Introduction
Why This Guide Matters
Evidence-based decisions are essential for survival in today’s competitive landscape. For startups and small business owners, every resource allocation and market move can make or break your venture.
The research is clear: companies that accept data-driven decision-making can see an impressive revenue boost of 10-30%. More importantly, 71% of customers expect brands to deliver personalized interactions, which is only possible through sophisticated data analysis.
How to Use This Article
We’ve designed this as a step-by-step guide you can return to repeatedly. Bookmark it, share it with your team, and use each section as a reference as you build your data capabilities.
Why Data Beats Gut Feel: The Case for Data-Driven Decision-Making
More than half of Americans trust their gut over hard evidence, even when facts clearly point in a different direction. While there’s a time for intuition, building your business on hunches alone is like navigating with a blindfold on.
Companies that accept business analysis using data for making effective decisions see revenue increases of 10-30%. These organizations also keep customers longer, run more efficiently, and make decisions with confidence rather than guesswork.
Your gut feeling is your brain’s pattern recognition from past experience. That’s useful but limited. Data tells you what’s actually happening right now, across your entire business, without emotional baggage.
Data-Driven vs. Intuition—Key Differences
Data-driven decision-making provides objective measurement instead of subjective interpretation, scalable insights that work across scenarios, and predictive power that helps you see what’s coming next.
PwC found that highly data-driven organizations are three times more likely to see major improvements in their decision-making. We’re not suggesting you ignore experience—think of data as your trusted advisor that helps you make better calls.
Four Core Benefits Every Leader Should Know
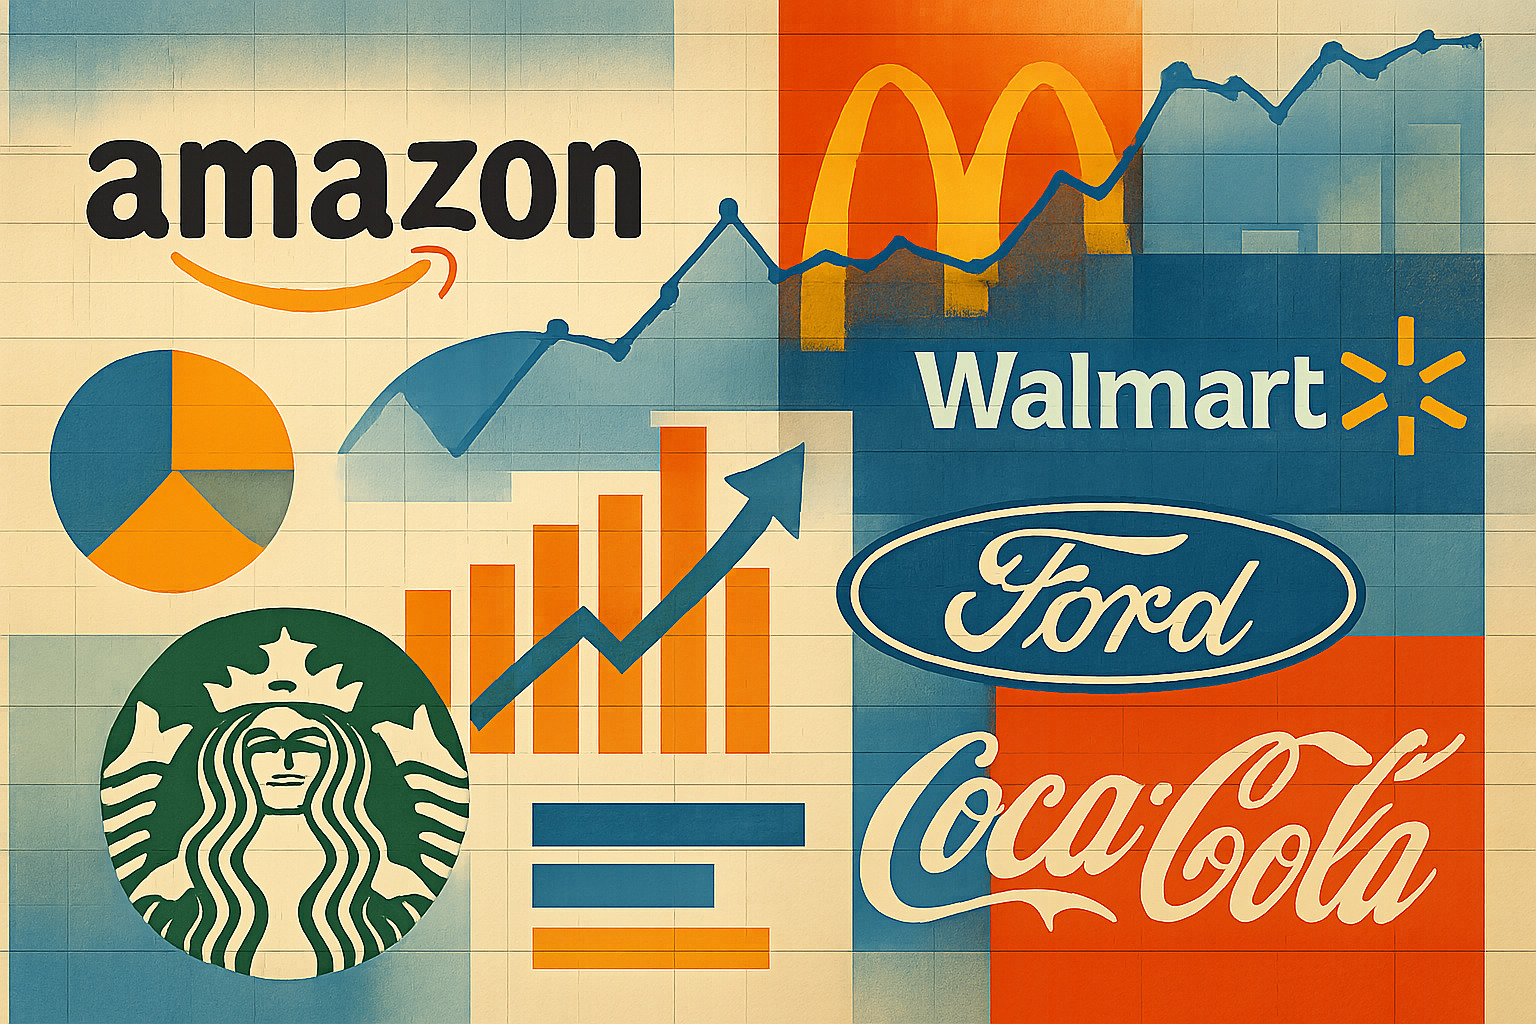
Improved profitability helps you identify which customers, products, and marketing channels actually pay off. Amazon’s recommendation system drives 35% of all their sales.
Superior customer experience becomes possible when you deliver personalized interactions. Thanks to latest research on personalization, 71% of customers expect personalized interactions.
Proactive management lets you spot trouble before it becomes a crisis, while strategic clarity cuts through opinions to show what’s really happening.
Overcoming Common Objections
“Analysis paralysis” is solved by focusing only on data that answers your biggest business questions. “Data is overwhelming” becomes manageable when you start with metrics that directly impact your bottom line. “We need quick wins” assumes analysis takes forever—simple trend analysis can reveal opportunities you can act on today.
The 5-Step Framework for Business Analysis Using Data for Making Effective Decisions
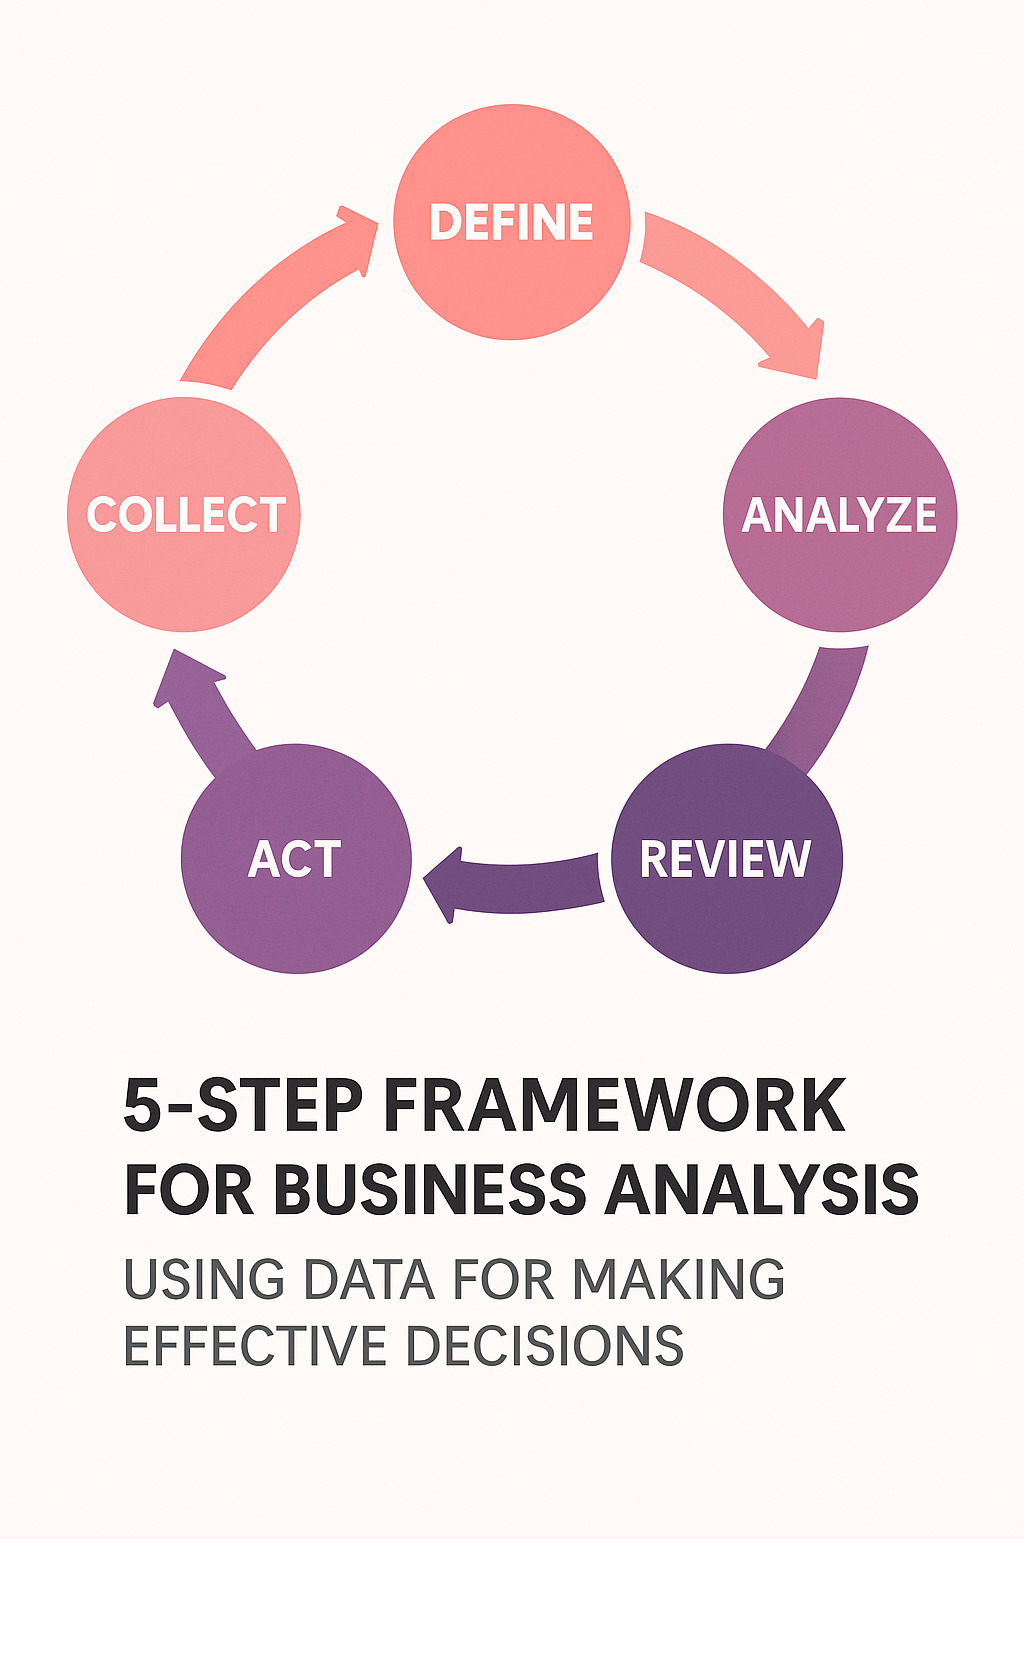
Business analysis using data for making effective decisions doesn’t have to feel like rocket science. Most entrepreneurs get overwhelmed because they try to tackle everything at once. Our 5-step framework breaks the process into manageable pieces.
Think of this framework as your GPS for navigating data. Each step builds on the previous one, creating a smooth journey from question to action. What makes this approach powerful is its iterative nature—you’re creating a continuous loop that gets smarter with each cycle.
Whether you’re analyzing customer behavior or making budget decisions, this framework works for any business challenge. For deeper insights into trend analysis, check out our business trend analysis guide.
| Approach | Speed | Accuracy | Scalability | Bias Level |
|---|---|---|---|---|
| Gut-Led | Fast | Variable | Low | High |
| Data-Led | Moderate | High | High | Low |
Data-led decisions might take slightly more time upfront, but they pay dividends in accuracy, scalability, and reduced bias. As you get comfortable with this framework, your decision speed will increase dramatically.
1. Define the Problem & Objectives
Think of this step as setting your GPS before a road trip. Business analysis using data for making effective decisions requires knowing your destination.
Start by listening to stakeholder pain points. What frustrates customers most? Where do employees feel stuck? These everyday headaches often hide your biggest opportunities.
Get specific with objectives. Instead of “improve sales,” try “increase online sales by 20% in the next quarter by identifying which product recommendations drive the most conversions.”
SMART objectives keep you focused: Specific, Measurable, Achievable, Relevant, and Time-bound. Every analysis should connect directly to your bottom line—whether boosting revenue, cutting costs, or reducing risks.
For financial decisions, our business budgeting for beginners guide offers complementary frameworks for objective-setting.
2. Collect & Prepare Relevant Data
Data collection is like gathering ingredients for a recipe—you need the right mix to create something valuable.
Internal systems hold your most valuable data. Your CRM knows customers better than anyone, while financial records tell the true story of what’s working. Website analytics reveal how people actually behave, not just what they say.
External datasets provide crucial context. Industry benchmarks show where you stand. Economic indicators help you understand whether problems are business-specific or market-wide.
Data cleansing is critical. Remove duplicate records, standardize formats so “New York,” “NY,” and “new york” mean the same thing, and validate accuracy through spot-checking.
ETL processes (Extract, Transform, Load) sound technical but are really about being systematic. Extract data from where it lives, transform it consistently, and load it somewhere useful for analysis.
3. Analyze & Visualize Insights
This is where raw numbers transform into insights that drive smart business decisions. Match your analytical approach to the questions you’re asking.
Descriptive analytics answers “What happened?” by spotting historical trends and establishing performance baselines. Diagnostic analytics goes deeper, uncovering “Why did it happen?” by connecting dots between causes and effects.
Predictive analytics forecasts “What might happen?” using models to anticipate trends and customer behavior. Prescriptive analytics recommends “What should we do?” by suggesting specific actions based on your data and goals.

Visualization transforms complex data into clear stories. The best charts and dashboards make insights so obvious that action becomes clear. Choose the right level of sophistication for your situation—sometimes a simple trend chart tells you everything you need to know.
4. Act—Develop & Implement Strategy
You’ve gathered insights and spotted opportunities—now turn that knowledge into business results. Business analysis using data for making effective decisions only creates value when you act on what you’ve learned.
Start with a detailed action plan breaking insights into specific steps. Each initiative needs a clear owner, realistic timelines, and defined success metrics.
Resource allocation becomes clearer with solid data. If analysis reveals email campaigns generate three times more qualified leads than social media ads, that’s a strong signal about budget allocation.
Pilot tests minimize risk during implementation. Test data-driven recommendations with a subset of customers or single product line before full-scale rollout. This validates your analysis while limiting exposure.
5. Review, Measure & Iterate
Successful companies treat business analysis using data for making effective decisions as an ongoing process, not a one-time project.
Define KPIs that matter. Focus on metrics directly connected to business objectives. Use both leading indicators (early warning signals) and lagging indicators (final results) for complete picture.
Build effective feedback loops that automatically capture results without manual intervention. Set up automated reports, alerts for key thresholds, and integrated analytics systems.
Regular review cycles keep you agile. Monthly reviews work for operational decisions, quarterly for strategic initiatives. Make these non-negotiable calendar items.
This iterative approach transforms good businesses into great ones by building organizational learning that compounds over time.
Essential Data Types, Methods & Tools
The world of business analysis using data for making effective decisions has become incredibly accessible. Research shows that companies embracing these technologies see significant revenue boosts.
Descriptive to Prescriptive: Choosing the Right Method
Trend spotting through descriptive analytics is your starting point—understanding what’s working and what isn’t. Root-cause analysis using diagnostic methods becomes detective work when problems arise.
Forecasting with predictive models helps anticipate busy seasons and market opportunities. Optimization through prescriptive analytics recommends exactly what you should do.
Building Your Technology Stack
Data warehouses are organized storage systems pulling information from different tools into one place. Cloud platforms have made this surprisingly affordable for small businesses.
Self-service BI tools let your entire team become data-savvy without computer science degrees. Automation handles routine reporting so you can focus on decisions.
For comprehensive tool options, our productivity tools review covers many that integrate with data analysis workflows.
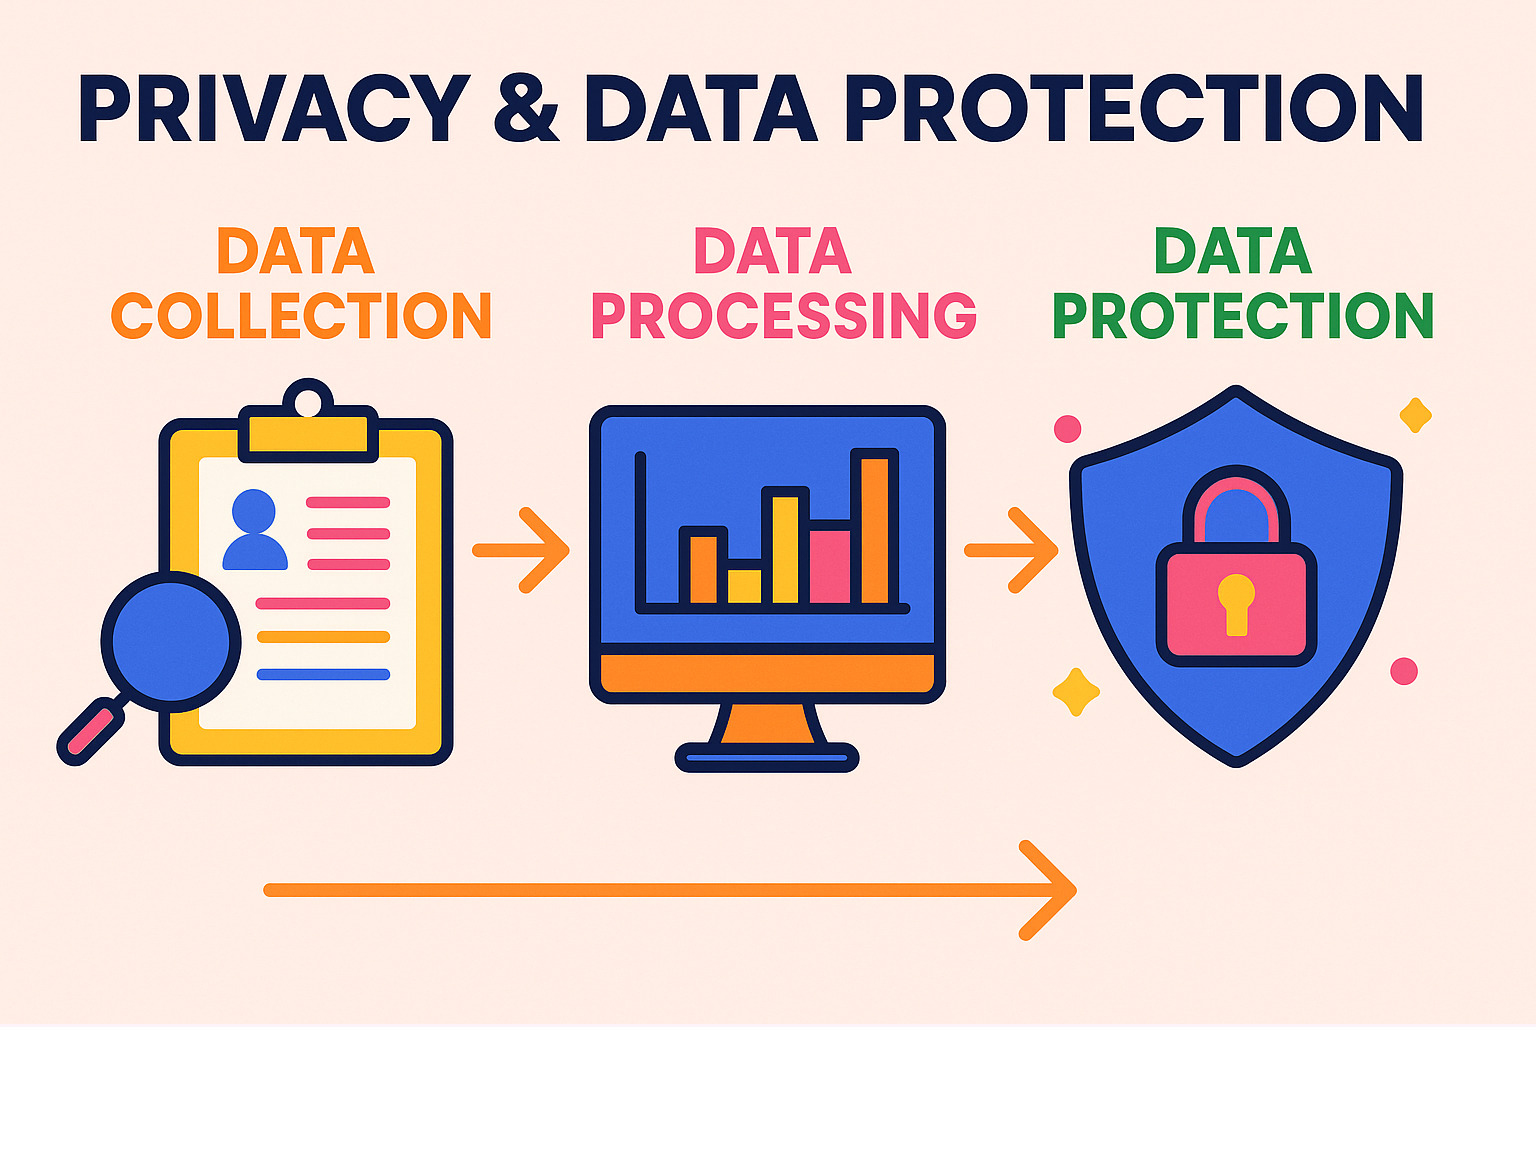
Ensuring Quality, Security & Ethics
Data accuracy isn’t optional—bad data leads to bad decisions. Set up validation rules, schedule regular audits, and create clear handling policies.
Privacy protection has moved from nice-to-have to essential. Develop clear policies for collecting, using, and storing data, then follow them consistently.
Compliance with regulations like GDPR and CCPA builds sustainable practices that scale with your business.
Measuring Impact & Building a Data-Driven Culture
The real magic happens when business analysis using data for making effective decisions becomes second nature across your organization.
Tracking the Right KPIs
Revenue lift should be your North Star metric. Track how data-driven decisions about pricing, features, or targeting directly impact sales and conversion rates.
Cost savings often provide quickest wins and easiest ROI calculations. Document savings from optimized marketing spend or operational efficiencies.
Customer retention improvements deliver compound returns over time. Monitor churn rate, customer lifetime value, and satisfaction scores.
Fostering Data Literacy Across Teams
Training programs work best when customized to real situations your team faces. Sales teams need customer data insights, marketing teams need attribution models.
Storytelling with data transforms boring spreadsheets into compelling narratives. Instead of “conversion rates increased 15%,” try “our new checkout process helped 150 more customers complete purchases, adding $12,000 in revenue.”
For scaling these efforts systematically, our startup growth strategies guide includes frameworks for building analytical capabilities.
Balancing Data and Intuition for Peak Performance
The best data-driven organizations don’t ignore intuition—they improve it with evidence. Expert judgment becomes more powerful when informed by data.
The sweet spot is where business analysis using data for making effective decisions improves rather than replaces human creativity and wisdom.
Real-World Success Stories & Common Pitfalls
Nothing beats real examples showing how business analysis using data for making effective decisions transforms companies.
Retail & E-Commerce: Personalization at Scale
Amazon’s recommendation engine drives 35% of consumer purchases by analyzing every click and purchase. They don’t just recommend products you might like—they predict what you’ll need before you know you need it.
Inventory forecasting has revolutionized retail stock management. Instead of guessing, smart retailers use predictive analytics to optimize inventory levels, reducing empty shelves and excess stock.
Healthcare & Education: Predictive Care and Student Success
Healthcare providers use EHR analysis to spot patterns human eyes might miss. One hospital system reduced readmissions by 25% by analyzing patient data to identify who needed extra post-discharge support.
Schools apply similar thinking to student success, tracking attendance and engagement to spot struggling students before they fail.
Manufacturing & Supply Chain: From Reactive to Proactive
Predictive maintenance has replaced “fix it when it breaks” with “fix it before it breaks.” Manufacturers schedule maintenance during planned downtime, reducing costs and improving safety.
Pitfalls to Avoid
Bad data quality is the most common mistake—garbage in, garbage out. Siloed systems prevent complete pictures when departments use separate databases.
Overreliance on historical data ignores that past performance doesn’t guarantee future results. Ethical missteps can destroy customer trust and invite regulatory scrutiny.
Frequently Asked Questions about Data-Driven Business Analysis
What’s the quickest way for a small business to start with analytics?
Start with data you already collect through sales systems, website analytics, and customer interactions. Focus on three fundamental metrics: customer acquisition cost, customer lifetime value, and monthly recurring revenue.
Google Analytics is free and powerful for website traffic. Your existing spreadsheet software handles most basic analysis. Pick one burning question about your business and use existing data to answer it.
How do descriptive and predictive analytics differ in practice?
Descriptive analytics is your rearview mirror, telling you what happened with statements like “Sales increased 15% last quarter.” Predictive analytics is your crystal ball, forecasting scenarios like “We expect 12% sales growth next quarter based on current trends.”
You need both working together—descriptive provides the foundation, predictive helps you anticipate and prepare.
How can we protect customer privacy while using their data?
Follow data minimization—only collect information you actually need. Transparency builds trust—be clear about what you collect and how customers can control their information.
Security measures should match data sensitivity. Implement encryption, proper access controls, and regular security check-ups. Even if not legally required, regulations like GDPR and CCPA offer excellent blueprints for responsible data handling.
Conclusion
If you’re feeling overwhelmed, that’s normal. Business analysis using data for making effective decisions might seem daunting, but every successful entrepreneur started exactly where you are now.
The most important insights to remember:
Your business questions should drive your data efforts. Focus on problems that keep you up at night—those are worth solving first. The 5-step framework works whether you’re analyzing customers or planning budgets.
Building a data-driven culture takes time but pays dividends. When your team asks “what does the data say?” instead of going with gut feelings, you’re on the right track.
Here’s what to do this week:
Pick one burning question about your business and spend an hour looking for patterns in whatever data you have. Choose one simple analytical approach and test it out. Share findings with your team and measure results of any changes.
The journey from hunches to insights is incredibly rewarding. Every piece of data tells part of your business story, and connecting those pieces makes the bigger picture amazingly clear.
Ready for the next step? Check out more information about how to start a business for additional resources that complement your new analytical skills.
Your data is waiting to tell you something important. The question isn’t whether you have enough information—it’s whether you’re ready to listen.